Introduction
This project was completed as part of my York University’s School of Continuing Studies UX Design Certificate . For the introductory class, we were asked to conduct a 10 question survey on Google Forms to gauge public perception of existing social media platforms to gain a high-level sense of how people use, and what they think of current social media offerings.
This summary report analyzes the data collected from 47 respondents .
Key Findings
- The main draw of social media is the utility it gives people to stay connected to people and communities that they deem important.
- People's primary complaint about social media isn’t the technology itself, but how other humans interact and behave on the platforms.
- Social media users want more tools and control over what they see, in part to mitigate the negative behaviours of other users.
- Users want a platform that helps them parse misleading or unwanted content.
Why Do People Use Social Media?
Overwhelmingly, people use social media platforms to stay connected to family and friends and participate in various communities. Survey respondents also cited social media as a place to find entertainment and information on personal interests and news. A minority of respondents reported using social media to share their opinions.
People’s responses on why they used social media were broadly consistent with what they liked and disliked about the platforms. Respondents cited a connection with friends and family as the main reason they enjoyed social media. Negative behaviours and opinions were the primary frustrations users had with existing social media platforms.
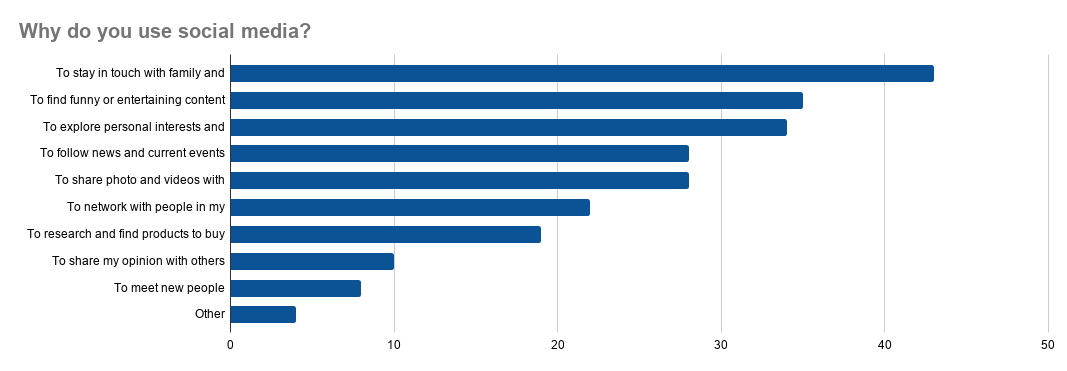
(Click Graph To Enlarge)
How Do People Currently Use Social Media
Answers to closed questions were used to collect information on what social media platforms people used and how they interacted with existing platforms. The survey responses indicate that people use multiple social media platforms every day, and they perform a wide range of tasks on the platforms currently available.
What social media platforms are used?
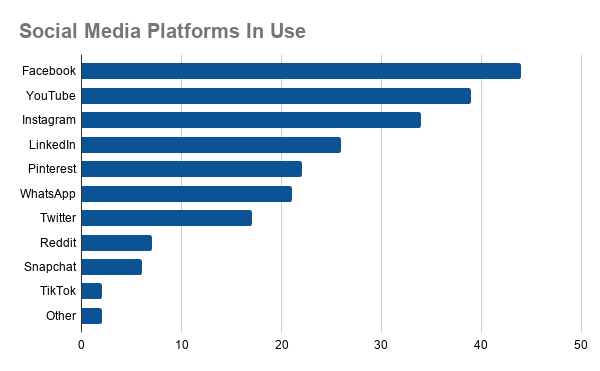
Among respondents, FaceBook is the most popular social media platform currently in use. But, as I only recruited survey respondents from FaceBook and Instagram (which doesn’t allow direct links) this data might be skewed a bit. The majority of respondents had to be on FaceBook to access the survey.
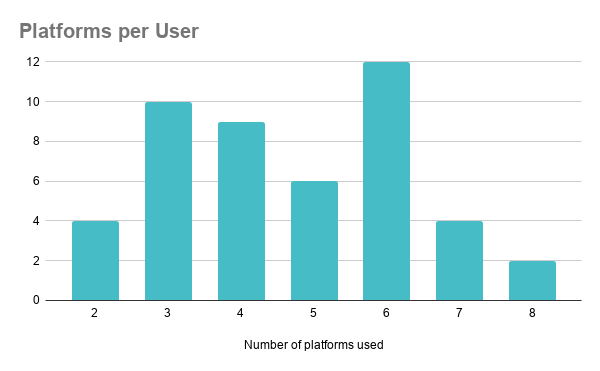
All respondents reported using at least two platforms. Using three to six different platforms was most common among surveyors.
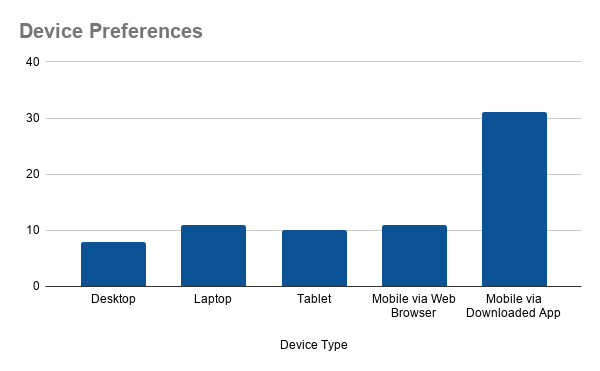
What devices do they use?
Respondents preferred to access their platforms on portable devices, with mobile devices being the most popular device either via a web browser or a dedicated app.
What do people do on social media platforms?
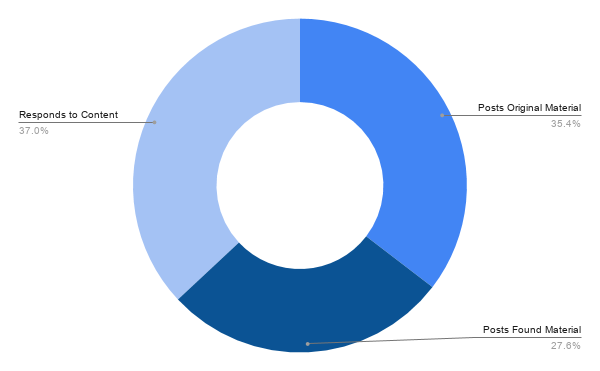
Interaction types fall into three broad categories: posting original content, posting found content and responding to content . Users slightly favoured responding to content and posting original material interactions to posting found material interactions.
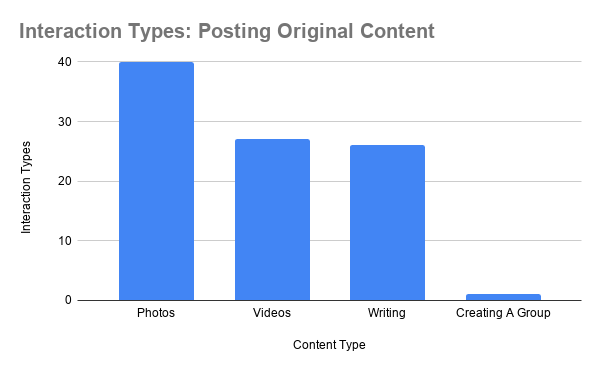
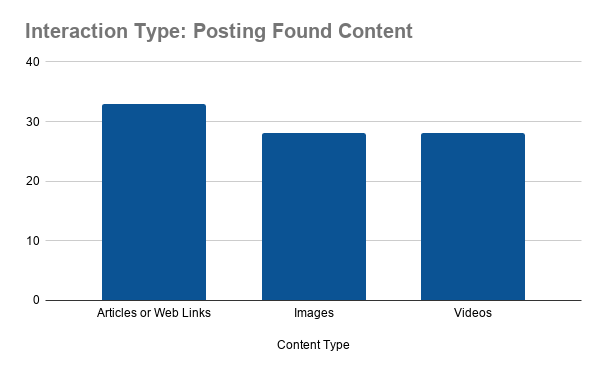
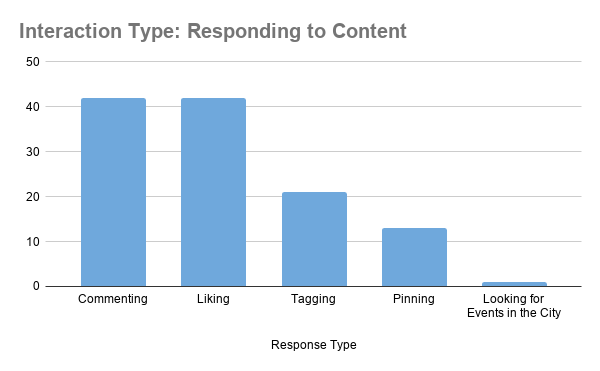
Photos are the most popular original content to post. Written articles are the most popular found content to post, and respondents have a clear preference for commenting and liking content to other forms of content interaction.
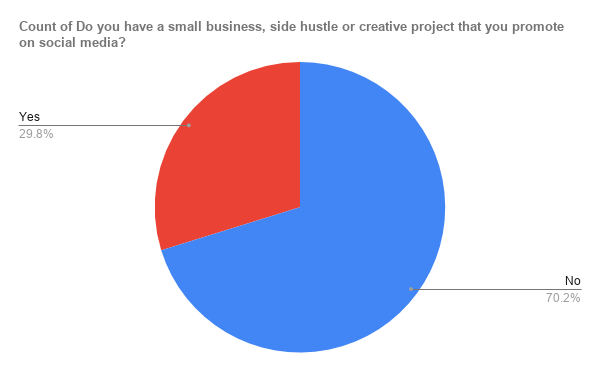
Personal Use vs. Business Use
A sizable minority of users have a business, side hustle or side project they promote on social media, but most respondents are interacting with the platform as individual users.
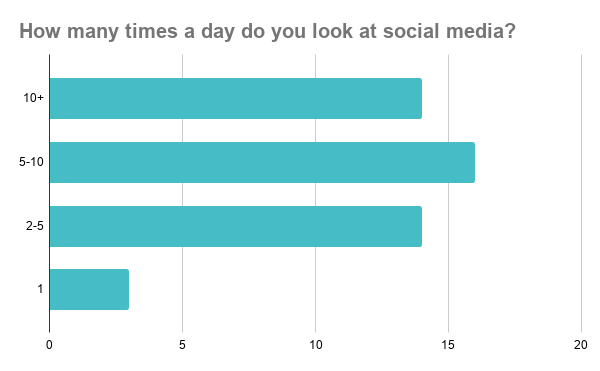
How often do people check social media?
All respondents were daily users of social media, with most respondents checking their platforms five or more times a day. While ‘not every day’ was listed as a choice in the survey no one selected that option.
How Do People Feel About Social Media
Responses to open-ended questions have been collected, analyzed and placed in broad categories to determine how survey respondents feel about various aspects of social media.
Questions were placed at the beginning of the survey to ensure respondents were not fatigued while answering, or biased in any way by the selection of closed questions that followed.
Interestingly, people had a wide variety of frustrations with social media, but most were attracted to the idea for the same reason.
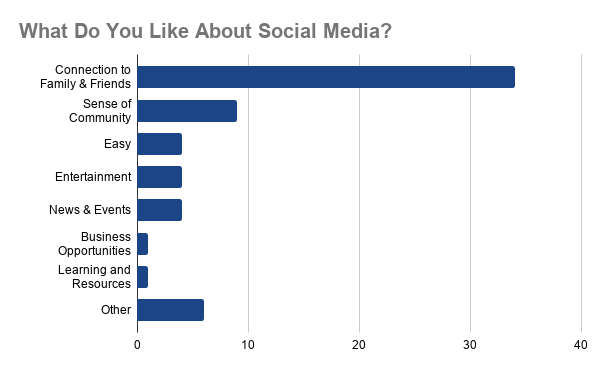
What do people like about social media?
When asked “What do you like about social media?” , respondents overwhelmingly indicated that social media’s ability to keep them connected to family and friends was a primary draw.
“I like being able to connect with my friends and family and see their updates on their lives” or “Mostly I like seeing pictures of what my friends are up to, particularly now” were typical responses to the question prompt.
Many responses also saw social media’s ability to foster community as a big positive. Answers that talked about community were among the most positive.
“ Seeing photos and updates about my family and friends. I’ve met a lot of people with common interests who I probably never would have crossed paths with if it wasn’t for social media.” or “Ability to stay connected with people and have a worldwide community.” are examples of responses that positively mention community.
Many users mentioned several different positive aspects of social media in their answers. These users viewed social media as an enjoyable way to access information, for entertainment or other purposes, alongside the ability to let them connect to people.
“Entertainment. Seeing new ideas, and what my friends are up to.” or “Humour, hearing from friends (actual real world friends) amusing animal videos, looking at art ” are examples of people who are drawn to social media for several different reasons.
Overall, words like friends , community , connection and easy where the most used by respondents when asked what they liked about social media.
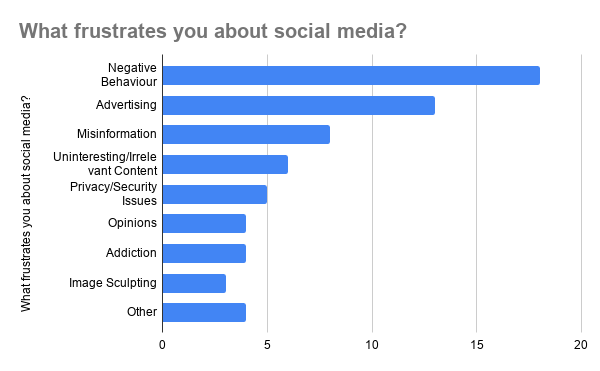
What frustrates people about social media?
When asked “What frustrates you about social media?” users had a range of complaints, but the most frequent answer was to exhibit frustration with the negative behaviours of other platform users. Other frustrations described irrelevant content, privacy and security concerns, and voiced opinions.
“It can be very toxic in how people interact and bully each other on it.” and “Negative and toxic people.” are examples of survey responses that indicated the behaviours of other users.
Words like annoying , stupid , toxic and moron were often used to describe other social media users.
Advertising was one of the other main points of frustration, particularly when users thought ads were replacing content they might want to see. “The algorithms that force products down my throat or promote the daily spam and click bait fluff articles that drown out my timeline.” is how one user explained this frustration.
Similar to answers about what users liked about social media respondents often listed several frustrations or dislikes. Misinformation, or fake news, was mentioned frequently. “Misinformation and extreme rudeness. “ and “Too many ads, too much fake news, too much hacking” were typical responses of this type.
Overall, words like ads , misinformation , negativity , fake , opinion and stupid were used the most by respondents.
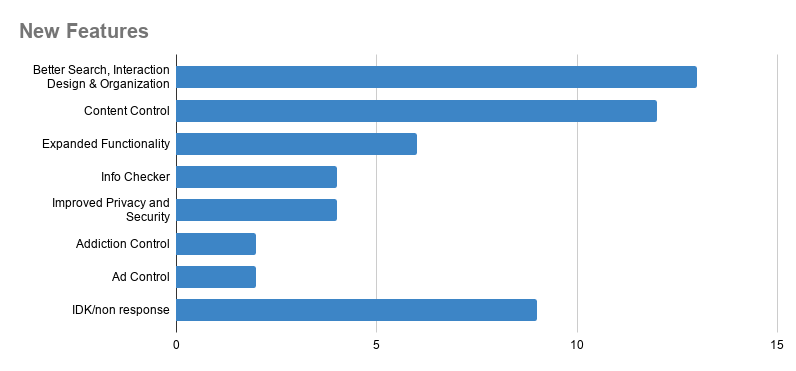
Improvements over New Features
When survey takers were asked, “If you could add a new feature to your favourite social media site, what would it be?” most requested improvements to existing features and functionality over novel new uses for social media.
There were some requests for completely new or underdeveloped features like “philanthropy “ , the “ability to play music with others” or “Live Q&A” . Overall, answers seem more concerned with improving the functionality social media currently provides and minimizing some aforementioned frustrations like ad blocking and privacy concerns.
Answers like “unbury logout button” or “better search” or “better photo organization” were the most common. Respondents also requested more control over the content they saw and shared asking for “A more personalized content feed” or “limiting screen shares and comments” among other requests.
A high number of people answered this question with answers like “IDK” or “Not Sure” which suggests that a new survey question needs to be written to replace it in future uses of this survey. A full 19% of data was unusable.
Openness To Joining A New Platform
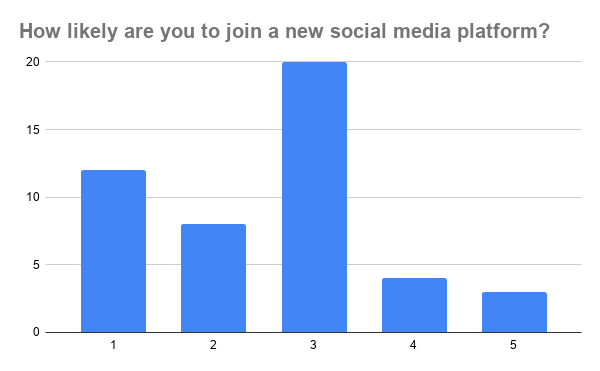
Despite the range of frustrations described by survey respondents, people seem neutral to reluctant on the idea of joining a new platform.
When given a quantitative likert question asking how likely they were to join a new social media platform users seemed neutral to against it.
Conclusions & Next Steps
Survey respondents already make daily use of multiple social media platforms. There does not seem to be an appetite for a new platform, despite many frustrations with current offerings. For a new platform to gain traction it would have to elegantly address the major frustrations mentioned by survey respondents.
Next Steps
If I were to move forward with this project I would first want to conduct more research in the following areas:
- What are the most popular revenue models currently in use that are not ad dependant? Can one of them be applied to a social media platform?
- Are there databases, AI or APIs out there that can help flag questionable content based on the source URL or text analysis? Can they be easily integrated into a social media platform?
- Look at behavioural psychology on group dynamics. Is there a way to design a site that naturally encourages positive interactions over mean or trolling ones? Have studies been done in analog situations that might be adapted to digital platforms?
I’d also perform some user tests on current social media sites to see how the existing UI patterns for interactions like search, hiding ads and unwanted content are working. How long do they take to find? Are they buried under other features? Do they even exist on mobile versions of the site?
Assuming I found encouraging answers in my second round of research, I’d design a ‘mobile first’ wire-frame and test it out on a small group of people to see how it works. Then I’d conduct another round of surveys to gauge how respondents feel about paying for social media access and whatever other potential issues I uncover.